By Tony Attwood
Leaving aside all the chatter about the super league, the question now is, how does this situation Arsenal find themselves in, compare with the past?
In the table below I’ve set out our position after 32 games first in three difficult years: 1930 under Chapman, 1976 under Mee and 1995 under Graham. Below that under our latest three managers from 2015 to date.
| Year | Pos | Pld | W | D | L | F | A | GD | Pts | Manager |
|---|---|---|---|---|---|---|---|---|---|---|
| 1930 | 16 | 32 | 12 | 6 | 14 | 53 | 48 | 5* | 42* | Chapman |
| 1976 | 18 | 32 | 11 | 7 | 14 | 35 | 38 | -3* | 40* | Mee |
| 1995 | 12 | 32 | 10 | 10 | 12 | 36 | 36 | 0 | 40 | Graham |
| 2015 | 2 | 32 | 20 | 6 | 6 | 63 | 32 | 31 | 66 | Wenger |
| 2016 | 3 | 32 | 17 | 8 | 7 | 55 | 33 | 22 | 59 | Wenger |
| 2017 | 6 | 32 | 18 | 6 | 8 | 64 | 40 | 24 | 60 | Wenger |
| 2018 | 6 | 32 | 16 | 6 | 10 | 61 | 43 | 18 | 54 | Wenger |
| 2019 | 5 | 32 | 19 | 6 | 7 | 65 | 40 | 25 | 63 | Emery |
| 2020 | 8 | 32 | 11 | 13 | 8 | 47 | 41 | 6 | 46 | Arteta |
| 2021 | 9 | 32 | 13 | 7 | 12 | 44 | 36 | 8 | 46 | Arteta |
*At this time it was two points for a win, but to give a comparison with later years we’ve calculated it for the 3 points of a win regime. Also goal difference was not used but goal average (goals scored divided by goals conceded) was used instead. Again for comparison, everything is reported in goal difference.
So first we have the 1929/30 season in which Chapman was manager for his fifth season. Thus far Arsenal had not won anything but were approaching their second cup final, which this season they won for the very first time.
But what makes this season particularly interesting was that after finishing in the lower reaches of the table, in the following season the club then went on and won the league with a record number of points the following season. So this low point of 42 points from 32 games was indeed the edge of one of the most successful periods in Arsenal’s history.
1976 was just five years after Arsenal’s double, and the club had declined very quickly thereafter. The management style of Bertie Mee became ever more authoritarian, and completely out of step with the players. Many seriously good players left seemingly because they could not get on with Mee.
1995 is included because that was the last time we were doing worse than we are now – at the end of Graham’s reign. Graham’s period as manager had been very successful with two titles, a European trophy, and the unique cup double, but this season he was running out of steam. However the tipping point were allegations that he had received money in return for arranging a transfer.
What this table shows is that on the eve of his great triumphs, Herbert Chapman delivered a season worse than this one – so this low position is not an immediate predictor of next season.
 However the figures do also show us how we have fared in recent years and how we have slipped compared to the norms of earlier seasons in the last two years.
The one part of the team that is holding up, as I have said so many times, is the defence. I’ve tried to show that through comparing the defence this season with clubs at the top of the league, and we are very close to the defensive achievements of clubs at the top of the league – apart from Manchester City. Indeed we are very close to the position Wenger had when guiding us to finishing second in the league.
So once again the evidence is that despite what the media says over and over again, it is not the defence that is failing.
But although our attack has not slipped back to the worst moments of the Mee and Graham eras, we are around 20 goals worse off than we used to expect to be in the latter part of the Wenger reign.
Thus whichever way we look at things we have slipped back, and it is the attack which has become the problem.
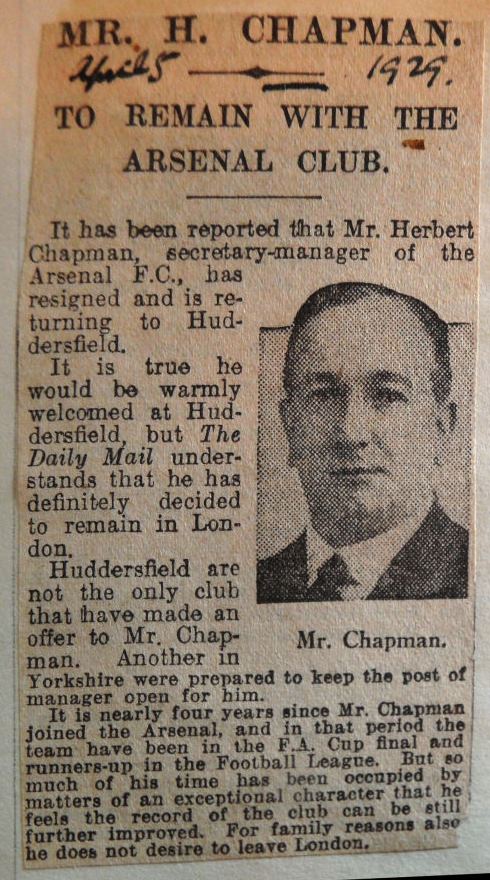
Below I’ve put the league table on 5 April 1929 to see just what state the club was in. And of course this “Chapman resigns” story is just a story from The Daily Mail. We don’t have any idea if it were true.
| Team | P | W | D | L | F | A | GAvg | Pts | |
|---|---|---|---|---|---|---|---|---|---|
| 1 | Sheffield Wednesday | 37 | 20 | 9 | 8 | 75 | 52 | 1.442 | 49 |
| 2 | Sunderland | 37 | 18 | 7 | 12 | 85 | 61 | 1.393 | 43 |
| 3 | Leicester City | 36 | 18 | 7 | 11 | 82 | 61 | 1.344 | 43 |
| 4 | Derby County | 37 | 18 | 7 | 12 | 77 | 58 | 1.328 | 43 |
| 5 | Aston Villa | 36 | 19 | 4 | 13 | 84 | 71 | 1.183 | 42 |
| 6 | Blackburn Rovers | 36 | 15 | 9 | 12 | 66 | 55 | 1.200 | 39 |
| 7 | Arsenal | 36 | 14 | 11 | 11 | 67 | 60 | 1.117 | 39 |
Once again, two points for a win, and clubs on the same points were separated by goal average. In modern parlance we had 53 points, and +7 goal difference.
So overall we are back to the darkest days of Chapman, Mee and Graham. Mee and Graham left the club when things were this bad. Chapman stayed and created a record beating system. Which is it to be?
The proof that something is seriously wrong with football refereeing and reporting
- How even a serious science magazine has used fake data on football
- Someone is trying to fake football stats – and doing it rather well,
- Crowdless stadia stats reveal fallacy of PGMO claims
- Proving unconscious bias by referees
- How clubs manipulate referees through their tactics
- Referees are not 98% accurate but only 75% accurate
